Staten Island's industrial vacancy hit 16.6% in the third quarter of 2025. Read the headline and you would assume the borough's warehouse market is unraveling. Read the underlying deliveries and tenant behavior and the picture inverts: this is a supply-shock repricing in a market where NYC's outer boroughs still command the highest industrial rents in the country. The window it opens for tenants and value-add buyers is real, and it is narrow.
The 16.6% number is not weakness. It is one 975,000-square-foot building printing all at once, in a borough that had absorbed almost no new supply since 2020.
That is the thesis. Everything below is evidence for it.
What actually delivered
Two facts do most of the work here.
First, Staten Island vacancy climbed sharply after 975,000 square feet at Matrix Global Logistics Park entered the market for the first time since 2020, according to Cushman & Wakefield's Q3 2025 MarketBeat coverage reported by CRE Daily. That single delivery is large enough to move a borough-level statistic on its own.
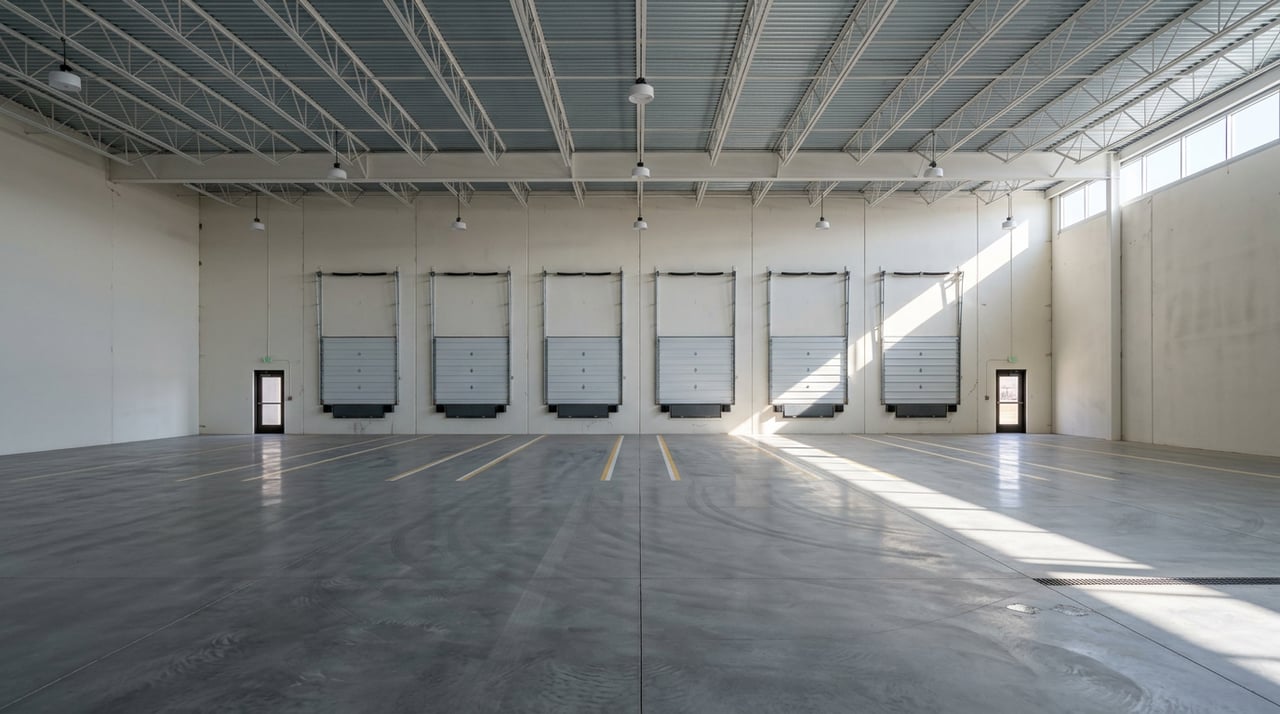
Second, Sagard Real Estate unwrapped nearly 332,000 square feet at One Nassau Place in April 2026, marketed by Cushman & Wakefield's Bill Waxman, David Gheriani, Rico Murtha, and Helen Paul. Cushman describes it as the largest new-construction single-story warehouse available in New York City, delivered with 36-foot clear heights, 60 loading docks, two drive-in doors, 174 parking spaces, and full sprinklers.
Put those together and Staten Island absorbed a multi-year pipeline in a compressed window. Vacancy did what math requires it to do.
Why the headline overstates the weakness
Across the outer boroughs, the Q3 2025 vacancy rate rose 120 basis points to 6.2%. Net absorption turned negative at -1.7 million square feet. Asking rents slipped $1.24 to $27.65 per square foot, with Staten Island's asking rent falling roughly $2.80 psf, per Cushman & Wakefield's outer-borough MarketBeat. On paper, that is a market in retreat.
The behavior underneath the numbers says otherwise. SymCRG's Q3 2025 read describes the vacancy increase as a function of new supply deliveries and normalized leasing velocity rather than tenant distress. Food manufacturing and third-party logistics continue to sign, and rents on the space tenants actually want are still climbing. Even after the drop, the outer boroughs hold the highest industrial rents nationwide by a considerable margin.
Translation: there are two Staten Island industrial markets right now. One is the freshly delivered, big-box, high-clear inventory that just hit availability. The other is the functional in-place stock in Mariner's Harbor, Charleston, and along the West Shore, where quality remains scarce. The average is misleading because the mix shifted.
What One Nassau Place resets
Before this cycle, a tenant looking for 30-foot clear, dock-heavy, sprinklered space at scale in the five boroughs had almost nowhere to go. That constraint is the reason outer-borough rents lead the country.
One Nassau Place changes the benchmark. Sagard's Brad Natale framed the project as a response to a market where supply "remains extremely limited," and the building's specifications, 36-foot clear, 60 docks, single or multi-tenant configurations, are what modern last-mile and light-industrial users actually spec. For the first time in years, a tenant can tour a Class A New York City warehouse instead of touring New Jersey and settling.
That has two second-order effects Tide watches closely:
- In-place Class B rents get compressed at the top. A tenant that would previously pay a premium for a functional older building now has a Class A alternative in-borough. Landlords of older Mariner's Harbor and Charleston stock have to sharpen concessions or accept a wider spread to new construction.
- The reset creates a value-add thesis. Older single-story warehouses with 18- to 22-foot clear heights, tight column grids, and limited dock counts are the properties most exposed. Owners who reinvest in clear height, dock doors, power, and yard become the natural second-tier product. Owners who do not become the discount option.
The tenant window, and its expiration
For corporate occupiers and retail operators sourcing distribution or last-mile space in NYC, the leverage math is unusually favorable and unusually temporary.
Cushman's outer-borough data shows the development pipeline expanded in Q3 2025 but future construction is expected to slow. SymCRG projects vacancy may drift modestly higher as remaining deliveries land, then tighten as absorption resumes against a thinning pipeline. Rent growth on quality space is expected to continue, with pressure isolated to older, less functional inventory.
A practical read for a tenant negotiating a Staten Island lease in the next twelve to eighteen months:
- Concessions are wider on newly delivered blocks than they will be after initial lease-up.
- Owners of older stock have more reason to trade TI dollars for term than they did two years ago.
- The West Shore's proximity to the Goethals Bridge and New Jersey port submarkets is priced in, but the differential to comparable New Jersey product has narrowed with the recent rent correction.
The window closes when the pipeline thins and the largest new blocks lease up. The Q3 2025 data is the signal, not the destination.
The investor read
Owner-user and private investor behavior has diverged from institutional behavior, and the divergence is the story.
SymCRG notes that user-buyers continue to dominate transaction activity because owner-occupiers are less sensitive to cap rate movements. Institutional interest remains, but bid-ask spreads have widened, and only quality assets with strong tenancy trade at premium pricing.
For Tide's owner-operator and mid-market investor clients, that produces three legible plays:
| Play | Target profile | Why it works now |
|---|---|---|
| Owner-user acquisition | 10,000 to 50,000 SF single-tenant buildings in Mariner's Harbor or Charleston | Rate-insensitive buyers face less competition from levered institutional bidders; basis resets during the vacancy print |
| Value-add repositioning | Older single-story stock with expandable clear height and yard | Class A delivery widens the spread the reposition can capture on stabilization |
| Long-hold core-plus | Newly delivered or recently modernized product acquired at soft pricing | Structural undersupply thesis intact; boroughs still lead nation on rents |
Bid-ask spreads staying wide is what makes the entry point. When institutional capital returns and cap rates compress, the trade is gone.
Submarket geography
Not every part of Staten Island industrial behaves the same way. The listing data across the borough concentrates in a handful of corridors:
- Mariner's Harbor hosts the largest cluster of active industrial listings, with older single-story stock and a mix of manufacturing, warehouse, and flex uses. This is where value-add math is most legible.
- Charleston, along the West Shore near the Outerbridge Crossing and Arthur Kill Road, is where the newer big-box product concentrates, including the Industrial Loop cluster and Sharrotts Road frontage. This is where One Nassau Place and Matrix reset the top of the market.
- Richmond Terrace and Arthur Kill Road corridors carry the flex and repurposed inventory that trades most often to owner-users under 25,000 square feet.
The listing platforms show current asking rents ranging from roughly $16 to nearly $30 per square foot for pure warehouse space, with specialty and small-bay flex pushing higher, consistent with the borough-wide average after the Q3 correction.
Three questions worth asking before you sign or bid
If vacancy is 16.6%, why aren't rents falling further? Because the vacancy is concentrated in a small number of newly delivered blocks. The functional in-place inventory tenants actually want, dock-heavy, sprinklered, with usable clear height, remains tight. Averages hide that split.
Does the West Shore still trade at a discount to New Jersey port submarkets? The rent gap has narrowed after the Q3 2025 correction, but Staten Island still delivers Manhattan access without the bridge-and-tunnel penalty for last-mile routes serving southern Brooklyn, Lower Manhattan, and the North Shore. The differential now runs through congestion pricing exposure and truck routing, not just headline rent.
How long does the tenant leverage window last? Cushman's outlook has new construction slowing after the current pipeline delivers. SymCRG expects quality space to stay scarce even as headline vacancy drifts. A reasonable planning horizon is twelve to eighteen months of unusually wide concessions on newly delivered blocks, tightening from there.
Staten Island's industrial market is not softening. It is repricing around a supply shock in a structurally undersupplied borough that still leads the country on rents. Tenants who move during the reset lock in terms they will not see again this cycle. Owners and investors who read the split, quality scarce, average softened, find their basis and their reposition thesis at the same time.
Tide Realty Group works Staten Island industrial from both sides of the table, sourcing owner-user and value-add acquisitions, running dispositions and leasing for landlords, and structuring the debt and equity behind the trade. When you are ready to price the window, rise with us.